
Are you a fan of the Linux command-line? I know I am. Some folks love it. Some folks would rather a GUI interface of some kind. There are many reasons why some developers or *nix admins love the command line. I’m not going to debate that in this article. What I’m going to do is show you an awesome little tool I developed for command-line lovers like me.
Say hi to ‘hi’, a command-line, terminal-based Host Information tool.
“hi” is a command-line tool designed to monitor and display the status of various services running on a Linux host. The services and their respective checks are customizable via a YAML configuration file, allowing for flexibility to suit different monitoring needs. This tool leverages the Rich library to provide visually pleasing output that includes UTF8 status icons, so it should be run in a terminal that supports the UTF8 character-set.
Download from GitHub
“hi” can be found on GitHub at https://github.com/jbobbylopez/hi. This tool is still in it’s early development stages. Some tests have been defined in test_host_information.py, and will continue to be improved in order to guide development.
Once you check-out that repository, one of the first things you’ll notice is that there is no script, file, or binary called ‘hi’. The script is actually called host_information.py. There are instructions in the README.txt for how to setup an alias to get the ‘hi’ command configured correctly.
A Little History
I’ve always loved developing and tickering with software and configurations on the command-line. The beauty of the BASH shell, it’s command-piping capabilities, and access to so many open source filtering and text manuipulation tools (such as awk, grep, sed, fzf, etc.) makes the Linux command-line an unmatched power-house of productivity for technology and information workers, not to mention hobbiests and tinkerers alike.
When I first started to think about the ‘hi’ tool, the goals I had in mind were simply to improve my command-line experience by creating a clean and readily available dashboard to review any concerns I might be interested in with the local host. That dashboard had to be a seamless part of my work-flow. I did not want to context switch (or reach for the mouse) when I was already deep in thought, managing the mental context of vim splits nested within tmux splits, and trying to remember if I back-grounded or exited Midnight Commander. Working on the command-line is kind of like a power-user working with multiple browser tabs, and browser windows, across multiple screens. Powerful work-flows can be created if you know how to use your tools properly.
Back to ‘hi’..
How It Started
‘hi’ started out as the following bash function:
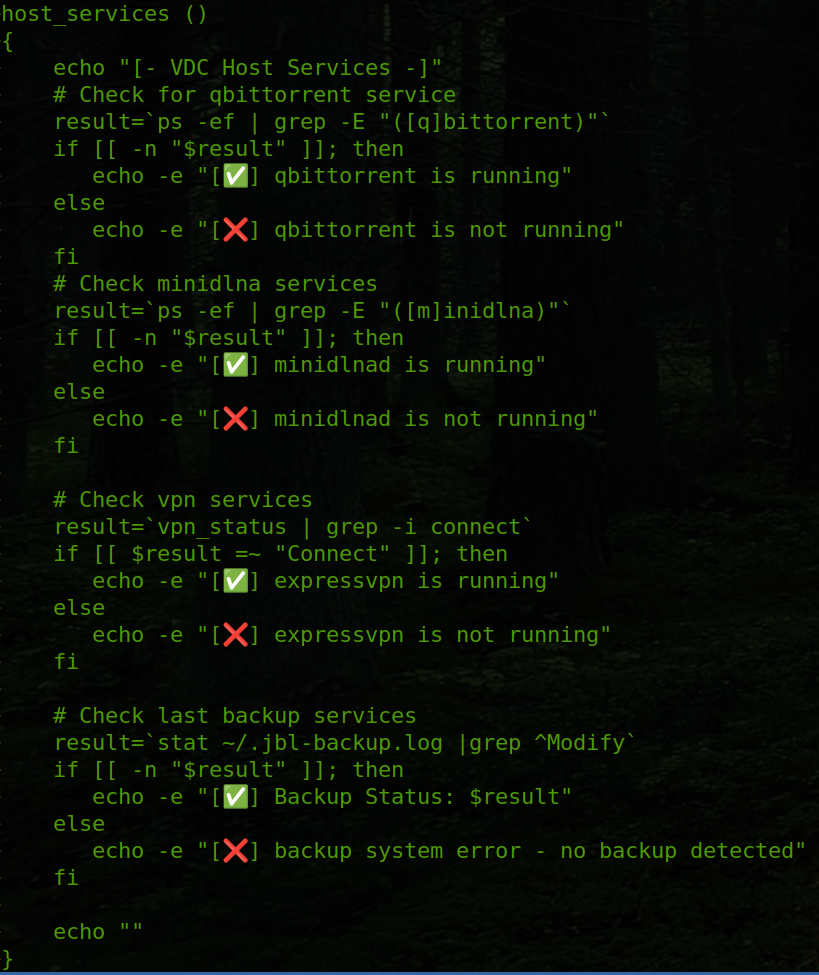
It was called host_services() and it was proving to be useful to do some simple monitoring of backups and other services.
Although it was useful, it quickly occured to me that this wouldn’t be very scalable, to just keep adding checks to this bash function. I had to rewrite it, and so I chose to do it in Python.
Once I re-wrote the code, things really started to take shape. It was becoming clear, the possibilities for how this tool might grow and evolve.
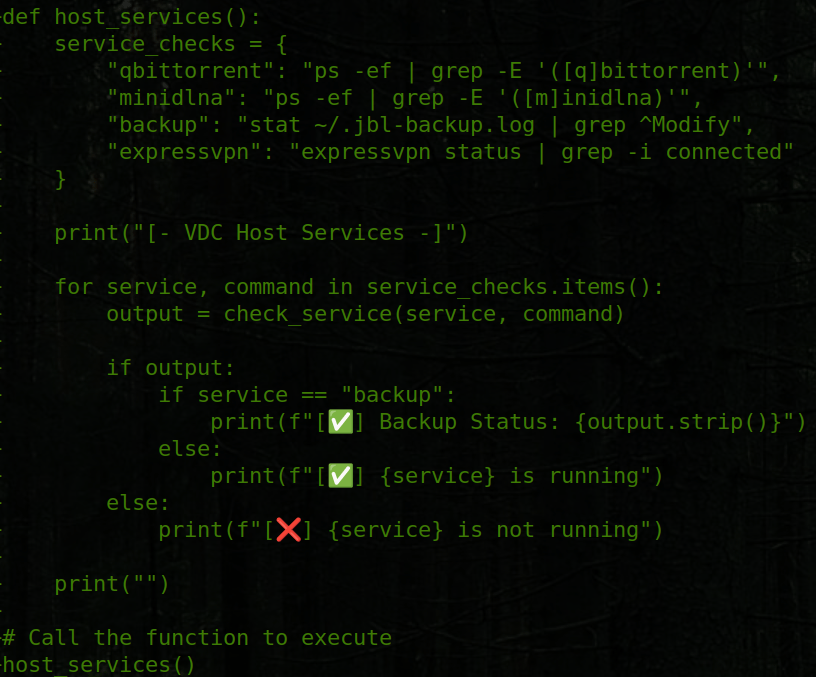
The initial Python code was a simple function that served it’s purpose well.
However, after I found myself using it regularly to check the status of backups, and whether or not my UPnP service was running, I realized that there were so many other little things that I would like to know quickly.
Much of this information I knew how to retrieve, but it was still rather cumbersome. For example, if I wanted to check if tmux was running, I could simply do a 'ps -ef | grep [t]mux' and find out, but I would have to do this for each service I was interested in.
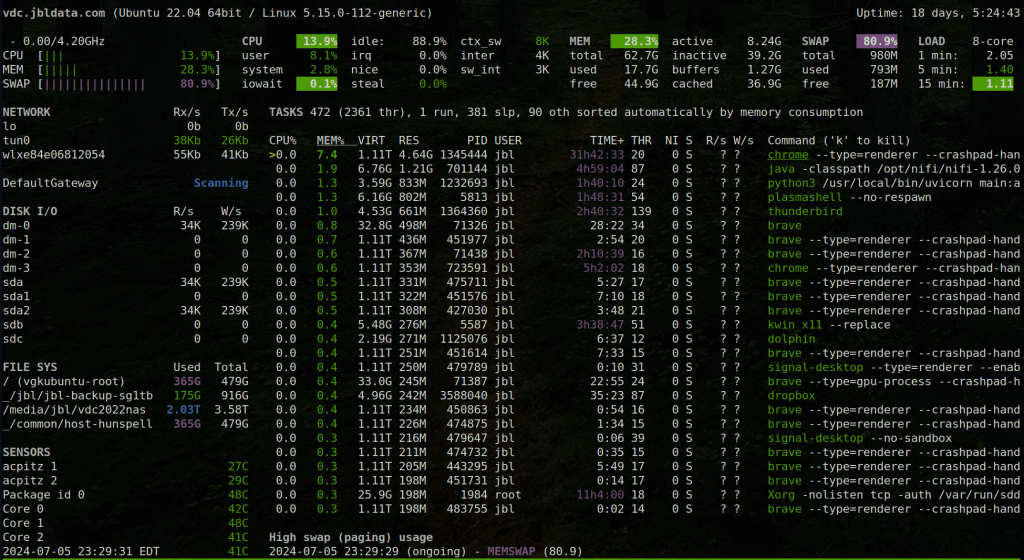
I would typically use this approach if I wanted to be very specific about the information I’m trying to retrieve. Instead however, if I wanted a bunch of system and process information at once, I could easily use either glances, or btop, which both provide an abundant amount of information about system resources and running processes. These are both excellent tools to get familiar with, I do recommend you check these out if you haven’t used them.
glances Output Example
btop Output Example
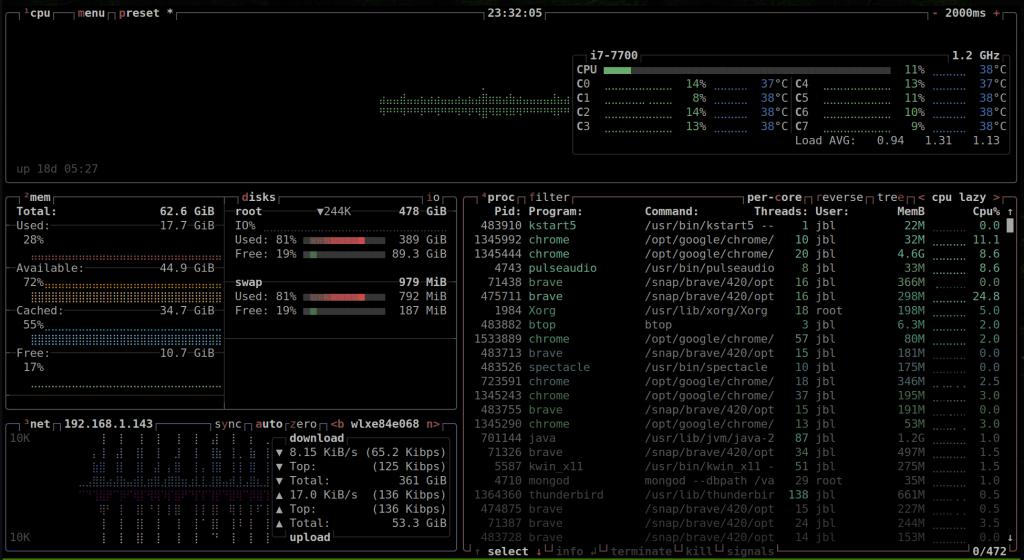
Both of these tools provide an abundance of information about CPU utilization, memory usage, disk usage, and hefty details on the processes that are running on the system. However for my particular interests, these tools often provided too much information.
As far as I could see, I had at least two choices. On one hand, I could use these tools (either glances or btop would suffice), which provided at times too much information. Or I could get surgical with grep on the command-line and get the bits of information I wanted from the system directly.
For me, there was no real in-between, no real compromise. Until now.
I wanted a tool that would give me just the right amount of detail, on the very specific system characteristics that I was interested in. I wanted this info quickly, “at-a-glance”, and organized in a way that made sense to me.
Say hi to ‘hi’ – the Host Information tool.
What is ‘hi’?
“hi” is a command-line tool designed to monitor and display the status of various services running on a host. The services and their respective checks are customizable via a YAML configuration file, allowing for flexibility to suit different monitoring needs. This tool leverages the Rich library to provide visually pleasing output that includes UTF8 status icons, so it should be run in a terminal that supports the UTF8 character-set.
Features
- Highly customizable checks that can report on any command-line executable status.
- Verifies the running status of various services.
- Full shell execution support, allowing for unmatched flexibility in crafting your monitors and checks.
- Can be used to report the last modified date of a backup log to ensure up-to-date backups.
- Can be used to monitor the connectivity status of Express VPN, or other VPN tools and services.
- Easy to modify to report information like local IPs, hostnames, and other useful information.
- Utilizes the Rich library for visually appealing console output with UTF8 status icons.
Here is an example of the output that ‘hi’ reports in the terminal:
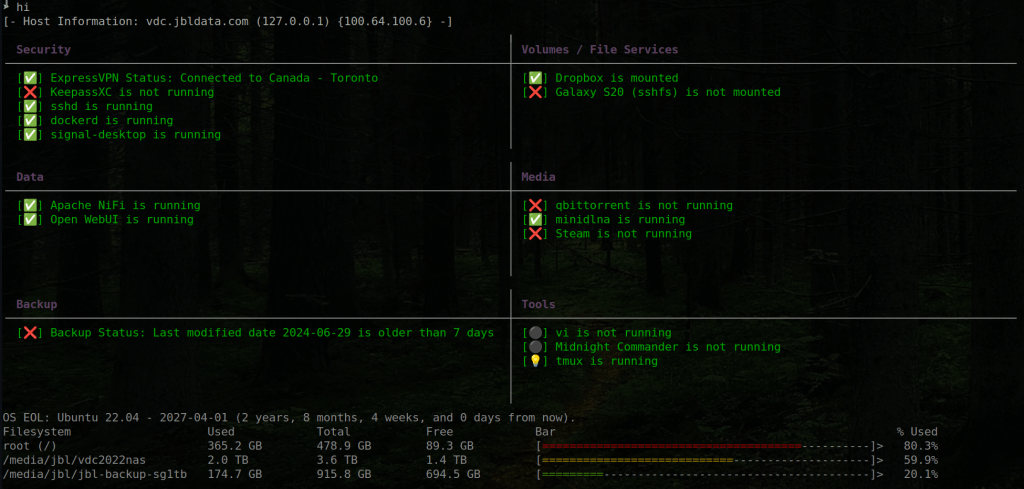
The output above shows monitoring of various tools and services, specifically categorized according to their purpose or function. The table is generated using the Rich.box python module which makes it easy to work with curses teminal output.
Using ‘hi info’, you can get some extended information reported from the ‘info:’ section of the check.yml configuration, along with the status of sub-checks which may be defined in your checks.yml file.
Example of the groups.yml and checks.yml configuration files:
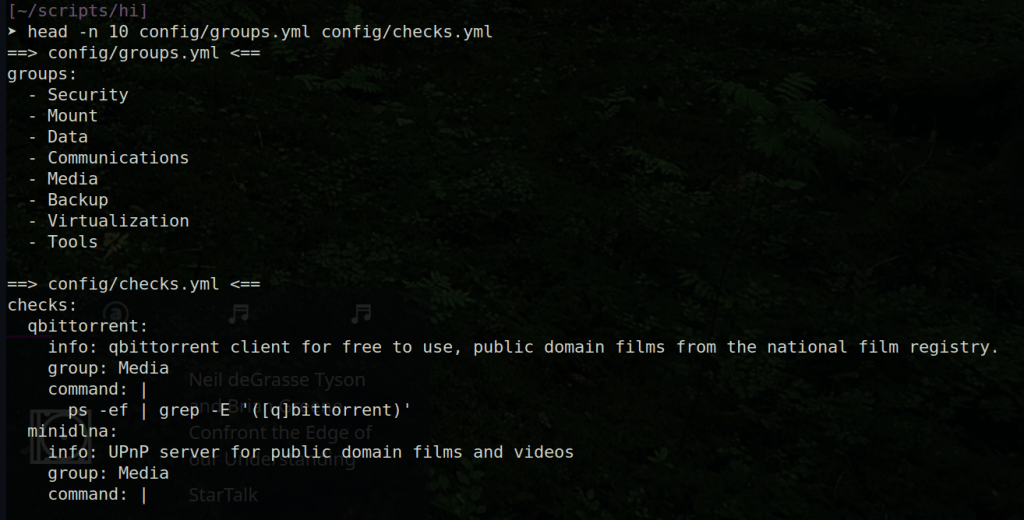
Groups can be customized in the config/groups.yml file, and only those system checks configured with the groups defined will be reported.
How System Checks Are Defined
The ‘hi’ checks are literally any valid bash command line that can return a non-zero value. If the command is successful, then the check is reported as positive. However, because the bash command includes the ability to use pipes, you have an immense amount of control around how your checks are implemented.
Using the CUPS Print Service as an Example
You can do a simple check to see if a process is running. Lets say for example you wanted to check if the CUPS print service is running on your host. Normally the fastest way to check would be to execute ps -ef | grep cups on the command-line, like so:
➤ ps -ef | grep cups
root      828443       1  0 Jun27 ?        00:00:00 /bin/sh /snap/cups/1058/scripts/run-cups-browsed
root      828451       1  0 Jun27 ?        00:00:00 /bin/sh /snap/cups/1058/scripts/run-cupsd
root      828648  828451  0 Jun27 ?        00:00:00 cupsd -f -s /var/snap/cups/common/etc/cups/cups-files.conf -c /var/snap/cups/common/etc/cups/cupsd.conf
root      828734  828443  0 Jun27 ?        00:00:00 /bin/sh /snap/cups/1058/scripts/run-cups-browsed
root     2458874       1  0 00:00 ?        00:00:00 /usr/sbin/cupsd -l
lp       2458875 2458874  0 00:00 ?        00:00:00 /usr/lib/cups/notifier/dbus dbus://
root     2458877       1  0 00:00 ?        00:00:00 /usr/sbin/cups-browsed
lp       2458897 2458874  0 00:00 ?        00:00:00 /usr/lib/cups/notifier/dbus dbus://
jbl      2539184 2453821  0 14:38 pts/5    00:00:00 grep --color=auto cups
It looks like the CUPS service is running! However I don’t want to have to issue that command every time I want to know if the service is running. It’s kind of noisy, and not the prettiest thing to look at if all I want to know is if the service is running.
Now, using ‘hi’, I can just use a similer ps -ef | grep -E "[c]ups" command as part of a newly defined check in config/checks.yml, as follows:
CUPS:
info: CUPS print service
group: Media
command: |
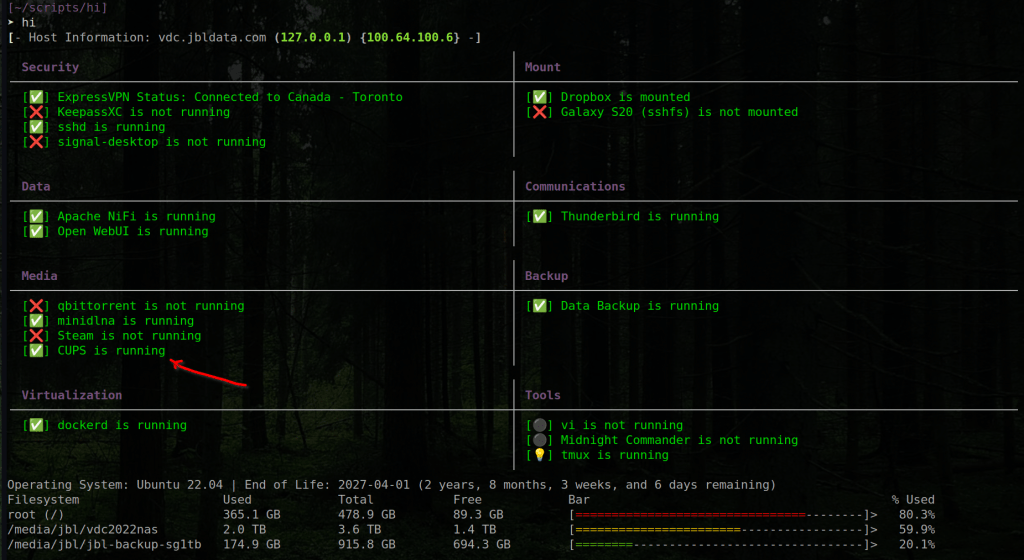
ps -ef | grep -E "[c]ups"Now when I run ‘hi’, I get a beautiful little indicator that tells me exactly what I want to know, amongst other information that might be important to me in general.
Output showing CUPS service indicator:
For an exmaple of a more complex check, take a look at the one defined for Express VPN:
   ExpressVPN:
     info: For general privacy and security.
     group: Security
     command: |
       expressvpn status | grep -i connected | sed "s/\\x1b\\[[0-9;]*[mGK]//g"
For Express VPN, I don’t just want to check if the process is running, but I’m interested in capturing a portion of the command output to be included in the ‘hi’ tool reporting. The regular expression used by the ‘sed’ command strips all ANSI escape codes from the expressvpn command output.
Currently, in order to leverage that Express VPN output, there is a custom handler defined in host_information.py:
         elif 'expressvpn' in process.lower():
             if re.search("Connected", output.strip()):
                 output_messages.append(f"[✅] {process} Status: {output.strip()}")
             else:
                 output_messages.append(f"[❌] {process} Status: {output.strip()}")
Instrumenting ‘sub-checks’
You can now define multiple sub-checks using the same check declaration pattern.
Here’s an example of how sub-checks are configured. We will use the ‘Thunderbird’ check which comes pre-defined in config/checks.yml.
In the following check defined for Thunderbird, you can see that not only is the main check for the running process in place, but there are also two sub-checks defined for checking Thunderbird’s ‘Memory Usage’ and ‘Version’ information.
  Thunderbird:
    info: My favorite mail client
    group: Communications
    indicators:
      positive:
        status:
        icon: 📧
      negative:
        status:
        icon: 📧
    command: |
      ps -ef | grep -E "[t]hunderbird"
    sub_checks:
      Memory Usage:
        command: |
          ps --no-headers -o rss -C thunderbird | awk '{sum+=$1} END {printf "%.2f MB (%.2f GB)\n", sum/1024, sum/1048576}'
        indicators:
          positive:
              icon: 💾
          negative:
              icon: 💾
      Version:
        command: |
          thunderbird --version
Custom Indicators
In the above Thunderbird check configuration example, you can also see the custom indicators which can be defined within the config/checks.yml file.
These custom indicators, when defined, will override the default ‘hi’ check indicators (in most cases).
You can see that custom indicators have been defined not just for Thunderbird, but also for it’s ‘Memory Usage’ sub-check. The ‘Version’ sub-check does not have any indicators defined, and so that sub-check will use the default indicators.
The flexibility of the ‘hi’ tool’s bash-based checks makes this fairly easy to implement.
Conclusion
I have found this tool to be a pleseant suprise, to both develop and to use.
There are many tools out there that can do some excellent reporting on host services, including running processes, CPU utilization, and file system services.
However I’ve come across very few tools (if any) that allowed me to customize the reporting, to show exactly what I wanted, and ONLY what I wanted – in a nice, organized, terminal-friendly way.
I plan to continue development on this tool as time permits. To keep me motivated and focused, I’ve added a ROADMAP.txt file to the repository that highlights some ideas and upcoming features that I plan to explore and implement.
I hope you find it a joy to use as much as I do. If you want to hear more about ‘hi’, visit my website The DevOps Joint, or connect with me on LinkedIn, or @jbobbylopez on X.com.
Enjoy!
Bobby
Update: I’ve also written about the ‘hi’ tool on DEV.to, check out the article Say “hi” to Your Linux Host Information for a few more tips and tricks on how to get the most out of the ‘hi’ tool.

Leave a reply to ‘hi’ shows it’s colors – The DevOps Joint Cancel reply