
- Summary
- The Starting Point: A Simple VM Utilization Report
- Core Functionality and Key Code Snippets
- The Iterative Process
- Challenges and Solutions
- The Final Product
- Reflections
Summary
A few weeks ago, I sat down for a focused 45-minute coding session to build a PowerShell script for analyzing Azure resource utilization. Starting with a simple goal—checking CPU usage for Virtual Machines (VMs)—the project evolved through iterative discussions into a robust, flexible tool for querying VMs, App Services, and SQL Databases. This session was a perfect example of how collaborative, iterative coding with an AI assistant can turn an idea into production-ready code in record time. Here’s how it unfolded, complete with key code snippets and insights from the process.
The Starting Point: A Simple VM Utilization Report
My initial need was straightforward: I wanted a script to report CPU utilization for Azure VMs post-provisioning to understand their performance. But as I thought through the problem, I realized I needed more—a tool that could handle multiple resource types, offer flexible output formats (console and CSV), include error logging, and work in both PowerShell 5.1 and 7+. The session began at 10:30 AM, and by 11:15 AM, we had a polished script: Get-AzureResourceReport.ps1.
The process was iterative, with each step building on the last. I’d suggest a feature—like adding App Services or idle time reporting—and we’d refine the script together, discussing trade-offs and implementation details. The result was a tool that’s both practical and extensible.
Core Functionality and Key Code Snippets
The script’s power lies in its modularity and flexibility. Below are the key pieces of functionality we developed, along with code snippets that show how they work.
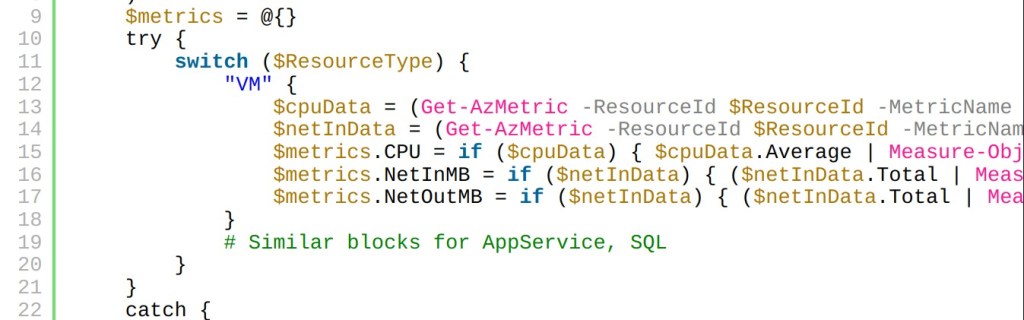
1. Fetching Metrics from Azure Monitor
The script uses Azure Monitor Metrics to pull CPU and network data, avoiding the need for Log Analytics. The Get-ResourceMetrics function handles metric retrieval for VMs, App Services, and SQL Databases, with error handling to flag missing data as “NoData”.
function Get-ResourceMetrics {
    param (
        [string]$ResourceId,
        [string]$ResourceType,
        [datetime]$StartTime,
        [datetime]$EndTime,
        [string]$LogPath
    )
    $metrics = @{}
    try {
        switch ($ResourceType) {
            "VM" {
                $cpuData = (Get-AzMetric -ResourceId $ResourceId -MetricName "Percentage CPU" -StartTime $StartTime -EndTime $EndTime -AggregationType Average -TimeGrain 01:00:00 -ErrorAction Stop).Data
                $netInData = (Get-AzMetric -ResourceId $ResourceId -MetricName "Network In" -StartTime $StartTime -EndTime $EndTime -AggregationType Total -TimeGrain 01:00:00 -ErrorAction Stop).Data
                $metrics.CPU = if ($cpuData) { $cpuData.Average | Measure-Object -Average } else { @{ Average = "NoData" } }
                $metrics.NetInMB = if ($netInData) { ($netInData.Total | Measure-Object -Sum).Sum / 1MB } else { "NoData" }
                $metrics.NetOutMB = if ($netInData) { ($netInData.Total | Measure-Object -Sum).Sum / 1MB } else { "NoData" }
            }
            # Similar blocks for AppService, SQL
        }
    }
    catch {
        Write-ErrorLog -Message "Failed to retrieve metrics for $ResourceType resource $ResourceId. $_" -ErrorObject $_ -LogPath $LogPath
        $metrics.CPU = @{ Average = "NoData" }
        $metrics.NetInMB = "NoData"
        $metrics.NetOutMB = "NoData"
    }
    return $metrics
}
This function queries metrics like Percentage CPU for VMs, handles errors (e.g., missing permissions), and converts network bytes to megabytes for readability.
2. Flexible Reporting Modes (Utilization and Idle Time)
I wanted the script to report both utilization (CPU %) and idle time (100% – CPU %). The “-ReportMode" parameter toggles this, implemented in Format-ReportEntry:
function Format-ReportEntry {
    param (
        [string]$ResourceGroupName,
        $Resource,
        [hashtable]$Metrics,
        [string]$ReportMode,
        [string]$TimeRange,
        [string]$SubscriptionName
    )
    $cpuAvg = if ($Metrics.CPU.Average -eq "NoData") { "NoData" } else { if ($Metrics.CPU.Average) { $Metrics.CPU.Average } else { 0 } }
    $cpuValue = if ($cpuAvg -eq "NoData") { "NoData" } else { if ($ReportMode -eq "IdleTime") { 100 - $cpuAvg } else { $cpuAvg } }
    $cpuLabel = if ($ReportMode -eq "IdleTime") { "AvgIdlePercent" } else { "AvgCPUPercent" }
    $netInMB = if ($Metrics.NetInMB -eq "NoData") { "NoData" } elseif ($Metrics.NetInMB -eq "N/A") { "N/A" } else { "{0:N2}" -f $Metrics.NetInMB }
    $netOutMB = if ($Metrics.NetOutMB -eq "NoData") { "NoData" } elseif ($Metrics.NetOutMB -eq "N/A") { "N/A" } else { "{0:N2}" -f $Metrics.NetOutMB }
    $status = if ($Resource.PowerState) { $Resource.PowerState } else { "N/A" }

    return [PSCustomObject]@{
        RGName        = $ResourceGroupName
        ResourceName  = $Resource.Name
        $cpuLabel     = $cpuValue
        NetInMB       = $netInMB
        NetOutMB      = $netOutMB
        Status        = $status
        TimeRange     = $TimeRange
        Subscription  = $SubscriptionName
    }
}
This dynamically switches between AvgCPUPercent and AvgIdlePercent, making the script versatile for identifying overused or underutilized resources.
3. Robust Error Logging
Error handling was critical for production use. The Write-ErrorLog function logs issues like authentication failures or missing metrics to a timestamped file:
function Write-ErrorLog {
    param (
        [string]$Message,
        [System.Management.Automation.ErrorRecord]$ErrorObject,
        [string]$LogPath
    )
    $timestamp = Get-Date -Format "yyyy-MM-dd HH:mm:ss"
    $logFile = Join-Path $LogPath "ErrorLog_$(Get-Date -Format 'yyyyMMdd').log"
    $logEntry = "[$timestamp] ERROR: $Message"
    if ($ErrorObject) { $logEntry += "`nStack Trace: $($ErrorObject.ScriptStackTrace)" }
    $logEntry += "`n"
    Add-Content -Path $logFile -Value $logEntry -ErrorAction SilentlyContinue
}
This ensured I could troubleshoot issues like “NoData” entries, which we later traced to potential RBAC permission gaps.
4. PowerShell 5.1 Compatibility
I needed the script to work in older environments, so we ensured compatibility with PowerShell 5.1. A key challenge was the ternary operator (?:) in Get-UserInput, which caused an error. We replaced it with an if-else construct:
function Get-UserInput {
    param (
        $Value,
        [string]$Prompt,
        $Default = $null
    )
    if (-not $Value) {
        $input = Read-Host $Prompt
        if ($input) {
            return $input
        }
        else {
            return $Default
        }
    }
    return $Value
}
We also added a custom Export-CsvQuoted function to ensure all CSV fields are quoted, mimicking PowerShell 7’s -UseQuotes Always.
The Iterative Process
The session was a back-and-forth of ideas and refinements:
- Starting Simple: We began with VM CPU metrics, using Get-AzMetric for its default availability.
- Expanding Scope: I requested support for App Services and SQL Databases, leading to a modular switch in Get-ResourceMetrics.
- Adding Features: Idle time reporting, CSV output, and error logging were layered in based on my needs.
- Troubleshooting: When I hit a “NoData” issue for running VMs, we explored RBAC permissions (Microsoft.Insights/Metrics/Read), metric delays, and logging to diagnose the cause.
- Ensuring Compatibility: PowerShell 5.1 errors (like the ternary operator) were fixed by swapping modern syntax for 5.1-friendly equivalents.
Each step felt like a natural progression, with clear explanations of trade-offs (e.g., sequential vs. parallel processing) guiding the design.
Challenges and Solutions
One hiccup was the PowerShell 5.1 error: “unexpected token ‘?’ in expression or statement” in Get-UserInput. We quickly identified the ternary operator as the culprit and rewrote it, keeping the script functional across environments.
Another challenge was “NoData” in reports for running VMs. We discussed potential causes—RBAC permissions, metric delays, or disabled metrics—and I was guided to check roles with Get-AzRoleAssignment and inspect logs in ErrorLog_YYYYMMDD.log. This collaborative debugging was invaluable, turning potential roadblocks into learning opportunities.
The Final Product
Before I finished my morning coffee, we had a script that:
- Queries VMs, App Services, and SQL Databases for CPU and network metrics.
- Supports utilization or idle time reports with -ReportMode.
- Outputs to console or fully quoted CSV files.
- Logs errors for easy troubleshooting.
- Runs in PowerShell 5.1 and 7+.
Example usage:
.\Get-AzureResourceReport.ps1 -ResourceGroupName "DevRG,TestRG" -SubscriptionName "MyAzureSub" -ResourceType "all" -TimeRangeDays 7 -ReportMode "IdleTime" -OutputToCsv "C:\Reports\IdleReport"
This produces CSV reports like:
"RGName","ResourceName","AvgIdlePercent","NetInMB","NetOutMB","Status","TimeRange","Subscription"
"DevRG","WebServerVM","54.33","1250.89","890.45","VM running","Last 7 Days (2025-03-30 14:30 to 2025-04-06 14:30)","MyAzureSub"
The full source code is available at Get-AzureResourceReport – A Powershell Script to Query Azure Resource Utilization on The DevOps Joint.
Reflections
This session was a reminder of how powerful iterative, collaborative coding can be. In just 45 minutes, we transformed a basic idea into a feature-rich tool, tackling challenges like compatibility and permissions along the way. The process was smooth because:
- Ideas were turned into code quickly, keeping the focus on functionality.
- Explanations were clear, helping me understand Azure Monitor and PowerShell nuances.
- Debugging was a team effort, making errors feel like puzzles to solve.
For anyone building tools like this, I’d recommend starting small, iterating often, and leaning on detailed error logging to catch issues early. Check your RBAC permissions upfront (Monitoring Reader is key), and don’t shy away from asking for compatibility tweaks if you’re stuck in an older environment.
This project left me excited to dive into the next one. If you try the script or have your own coding stories, I’d love to hear about them!

Leave a comment